Performance Highlights
Net Sales

Gross Profit / Gross Profit Margin

Operating Profit / Operating Profit Margin

Ordinary Profit / Ordinary Profit Margin

Profit Attributable to Owners of Parent / Net Margin

Earnings Per Share

| 2021/3 | 2022/3 | 2023/3 | 2024/3 | 2025/3 | |
| Net Sales (Millions of yen) |
9,486 | 11,565 | 13,456 | 14,514 | 15,568 |
| Gross Profit (Millions of yen) | 4,394 | 5,683 | 6,368 | 6,855 | 7,864 |
| Gross Profit Margin (%) | 46.3 | 49.1 | 47.3 | 47.2 | 50.5 |
| Operating Profit (Millions of yen) | 919 | 1,517 | 1,203 | 1,475 | 1,890 |
| Operating Profit Margin (%) | 9.7 | 13.1 | 8.9 | 10.2 | 12.1 |
| Ordinary Profit (Millions of yen) | 920 | 1,543 | 1139 | 1,498 | 1,947 |
| Ordinary Profit Margin (%) | 9.7 | 13.3 | 8.5 | 10.3 | 12.5 |
| Profit Attributable to Owners of Parent (Millions of yen) |
683 | 1,070 | 825 | 1,140 | 1,462 |
| Net Margin (%) |
7.2 | 9.3 | 6.1 | 7.9 | 9.4 |
| Earnings Per Share (yen) | 52.88 | 82.96 | 63.93 | 88.23 | 113.09 |
*We conducted a two-for-one stock split of the common shares held by shareholders on August 1, 2022. Earnings per share have been retrospectively adjusted, taking into account the stock split.
Asset Status
Total Assets

Net Assets

Book Value Per Share

| 2021/3 | 2022/3 | 2023/3 | 2024/3 | 2025/3 | |
| Total Assets (Millions of yen) | 14,694 | 16,416 | 17,033 | 18,201 | 19,471 |
| Net Assets (Millions of yen) | 12,198 | 13,254 | 13,716 | 14,580 | 15,969 |
| Book Value Per Share (yen) | 945.32 | 1,025.82 | 1,059.19 | 1,125.00 | 1,231.06 |
*We conducted a two-for-one stock split of the common shares held by shareholders on August 1, 2022. Book value per share have been retrospectively adjusted, taking into account the stock split.。
Key Performance Indicators
Equity Ratio

Return on Equity
_250331.png?width=2000&height=1404&name=11_En_%E8%87%AA%E5%B7%B1%E8%B3%87%E6%9C%AC%E5%BD%93%E6%9C%9F%E7%B4%94%E5%88%A9%E7%9B%8A%E7%8E%87(ROE)_250331.png)
Return on Assets
_250331.png?width=2000&height=1404&name=12_En_%E7%B7%8F%E8%B3%87%E7%94%A3%E5%BD%93%E6%9C%9F%E7%B4%94%E5%88%A9%E7%9B%8A%E7%8E%87(ROA)_250331.png)
Total Asset Turnover Ratio

Fixed Asset Turnover Ratio

Tangible Fixed Asset Turnover Ratio

Current Ratio

| 2021/3 | 2022/3 | 2023/3 | 2024/3 | 2025/3 | |
| Equity Ratio (%) | 82.9 | 80.6 | 80.4 | 79.9 | 81.8 |
| Return on Equity (%) |
5.7 | 8.4 | 6.1 | 8.1 | 9.6 |
| Return on Assets (%) | 4.7 | 6.9 | 4.9 | 6.5 | 7.8 |
| Total Asset Turnover Ratio (%) | 0.6 | 0.7 | 0.8 | 0.8 | 0.8 |
| Fixed Asset Turnover Ratio (%) |
2.3 | 2.7 | 2.3 | 1.9 | 1.9 |
| Tangible Fixed Asset Turnover Ratio (%) |
3.3 | 4.0 | 3.0 | 2.4 | 2.3 |
| Current Ratio (%) |
764.7 | 680.9 | 537.3 | 532.8 | 539.9 |
Cash Flow / Investment
Free Cash Flow

Capital Expenditure

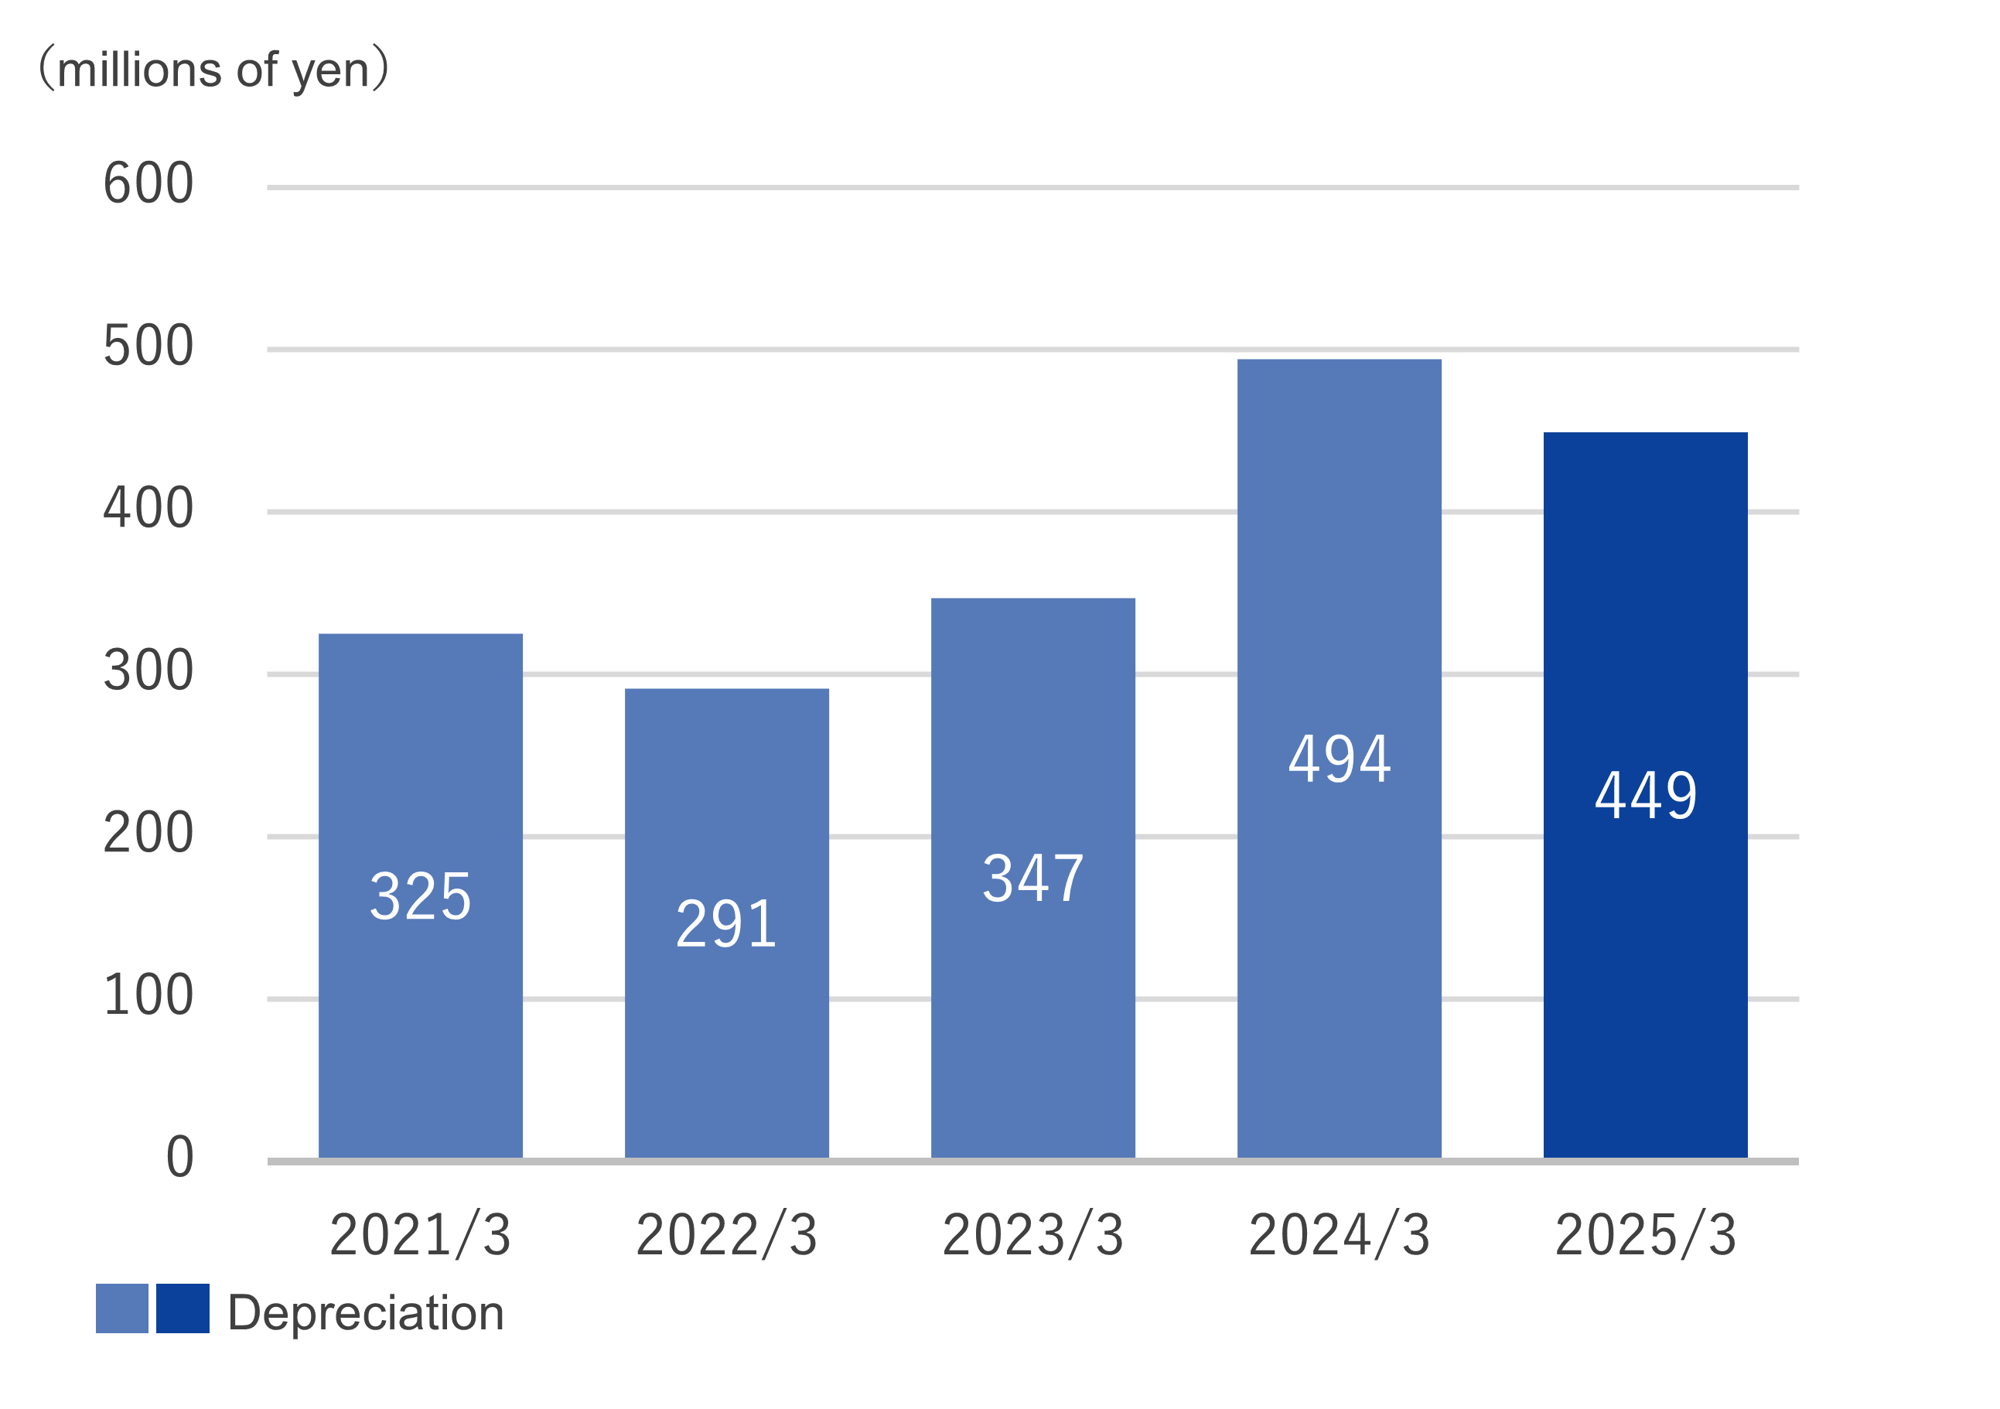
Depreciation

Research and Developement Expenses

| 2021/3 | 2022/3 | 2023/3 | 2024/3 | 2025/3 | |
| Free Cash Flow (Millions of yen) | 901 | 1,071 | -3,073 | 1,634 | -9 |
| Capital Expenditure (Millions of yen) | 428 | 232 | 3,673 | 812 | 1,466 |
| Depreciation (Millions of yen) | 325 | 291 | 347 | 494 | 449 |
| Research and Developement Expenses (Millions of yen) | 159 | 171 | 185 | 210 | 313 |
- Performance & Financial Information
- Stock Information


